From the shelf
Evil Charts: Build a Dashboard Chart People Can Read
Choose a chart for the question, label units and dates, and check the empty and mobile states when using Evil Charts in React.
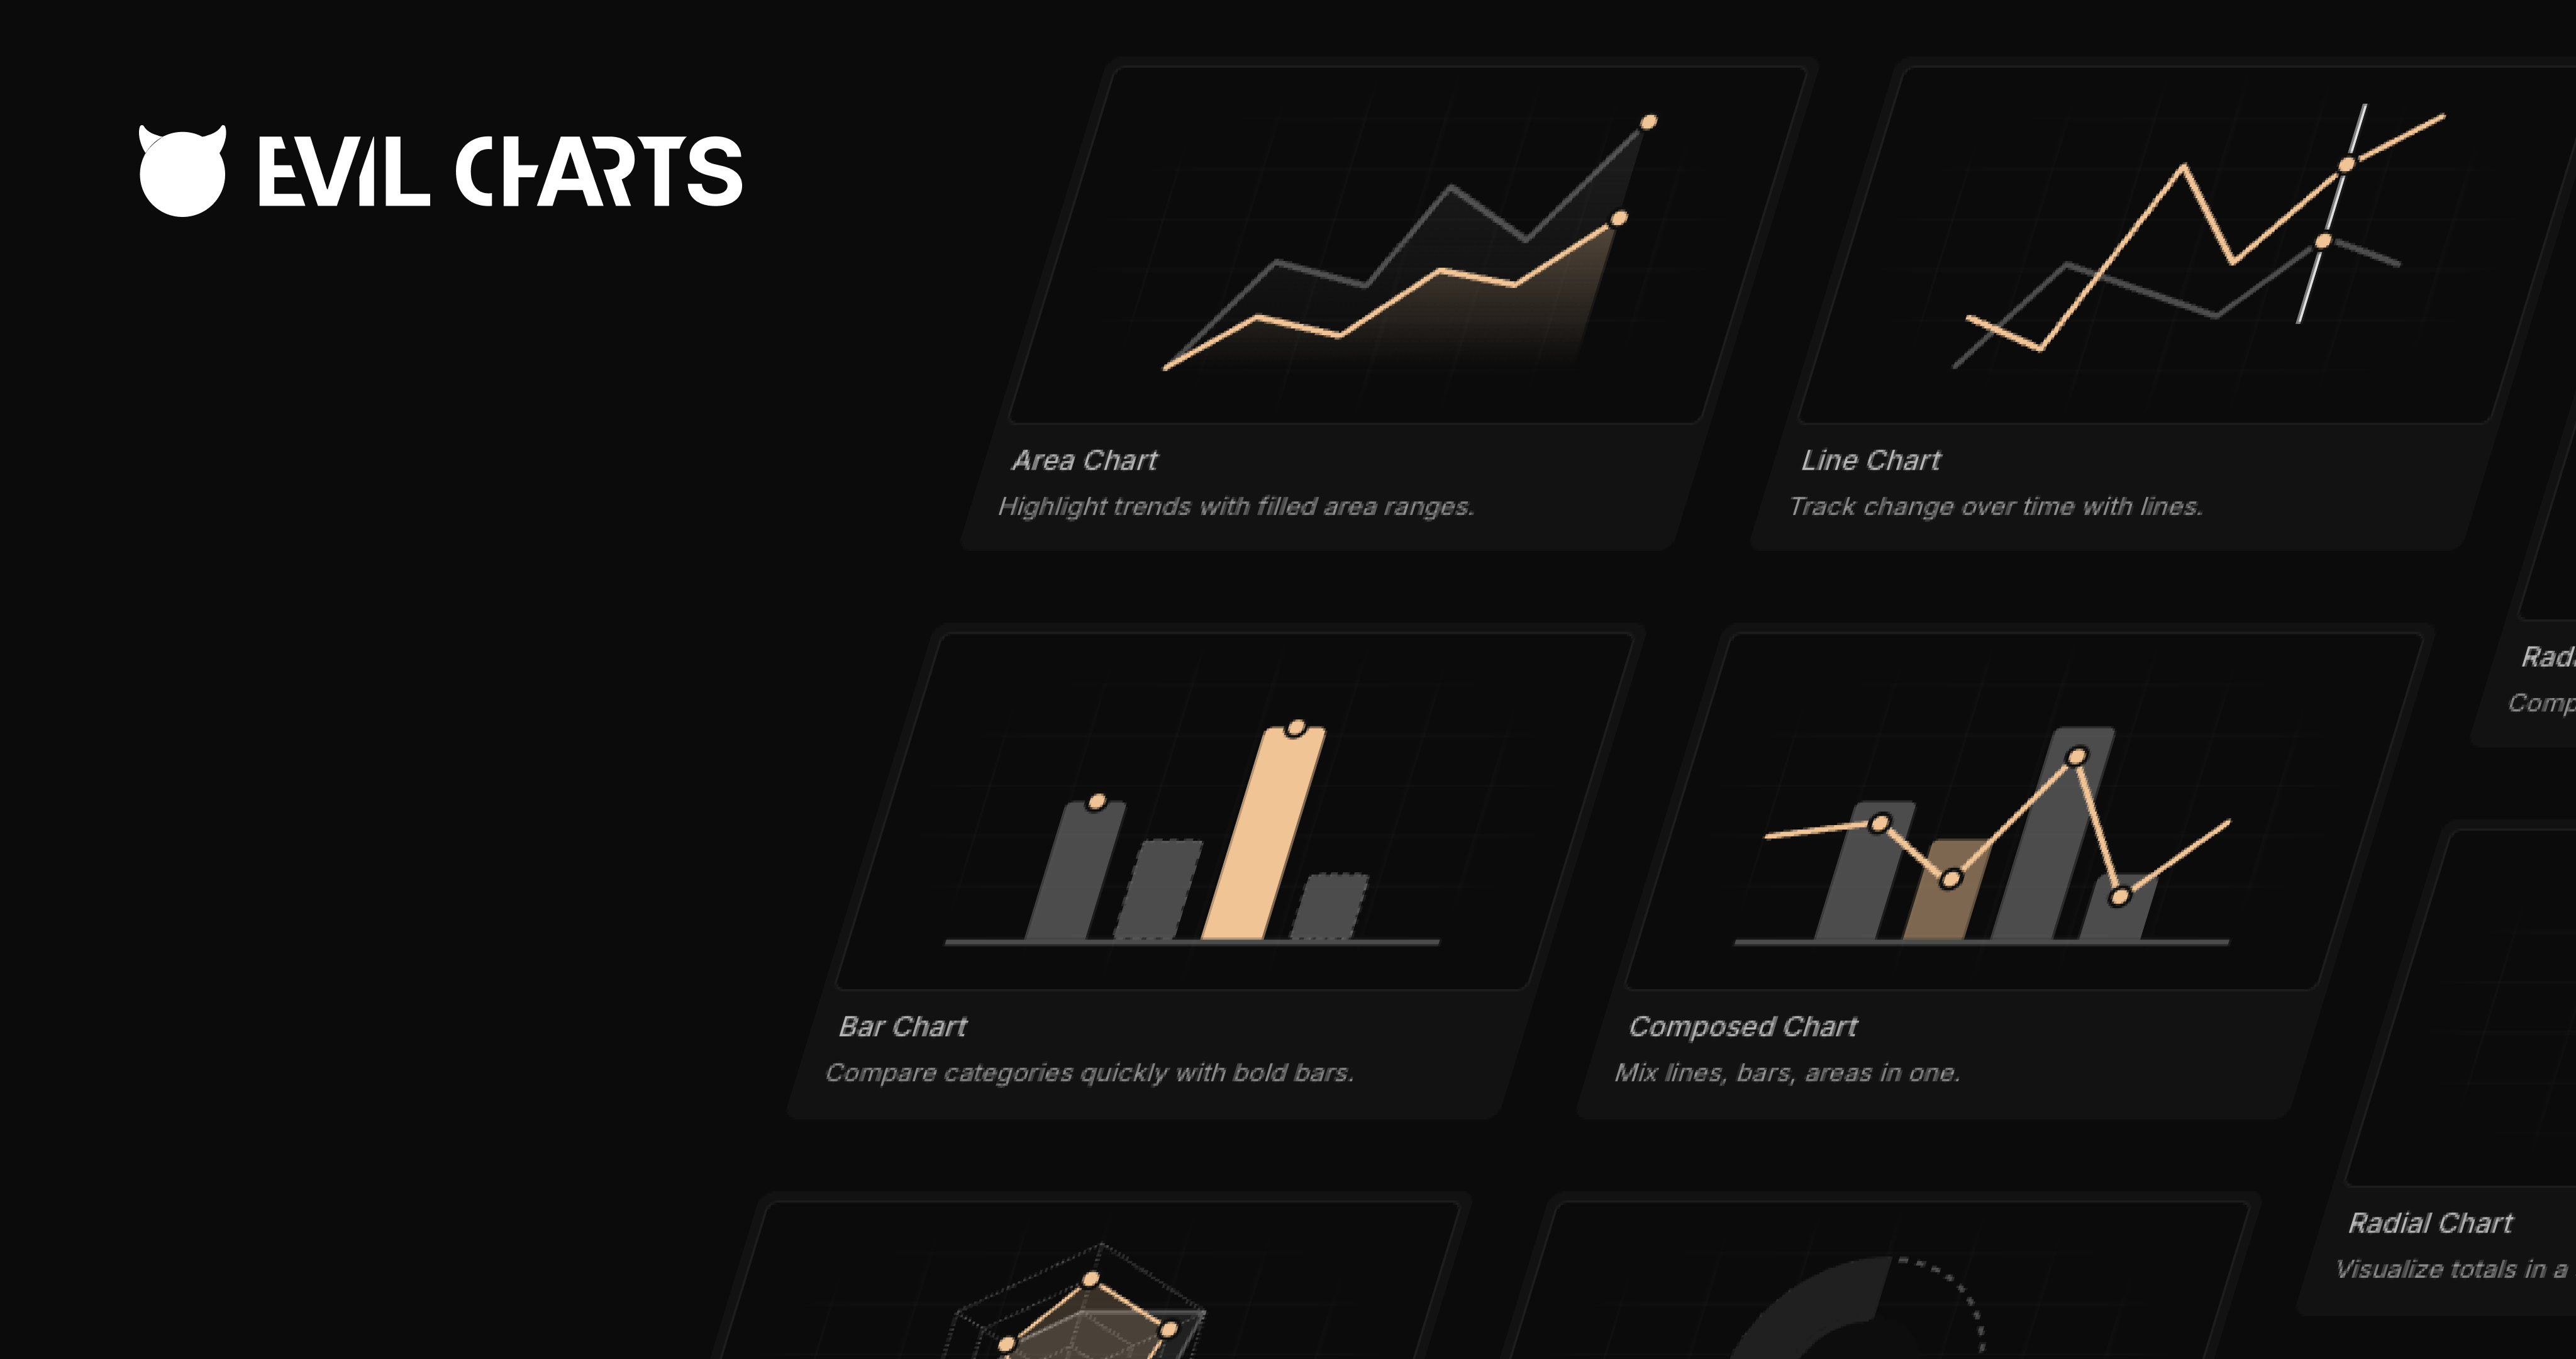
A dashboard chart should answer a question before it shows off a visual effect. Evil Charts provides open-source components built with shadcn, with Recharts and Apache ECharts variants. Choose the component around the comparison you need: a time trend, a category comparison or a part of a whole.
Define what one point means
For a sign-up chart, decide whether a point counts accounts created that day or accounts that completed activation. Write the unit and reporting time zone beside the chart. Two series with different definitions can look comparable while answering different questions.
Use a line for a time trend and bars for separate categories. Start with a small sample dataset whose totals you can calculate by hand before wiring the component to production data.
- Select one engine and inspect its current installation instructions.
- Map each data key to a readable label and consistent color.
- Check the rendered values against the source totals.
Pick the engine for the workload
The documentation describes Recharts as an SVG-based option and ECharts as supporting Canvas and SVG rendering. It recommends considering ECharts for denser or frequently updated data. This is a starting point, not a performance guarantee for your application.
Use the engine that fits the actual number of points and interactions. A seven-day chart does not need the same treatment as a live stream with thousands of samples. Measure a representative screen before changing the rest of a dashboard.
Make the chart useful without hovering
Give the chart a descriptive heading and a text summary of the main result. Include a table or accessible value list when exact numbers matter. Essential information should not exist only inside a pointer tooltip.
Check zero values, missing dates, no results and an unavailable API separately. A failed request should not appear as zero activity. Finally, inspect narrow screens, both themes and reduced motion so the chart remains understandable beyond its polished demo state.
Sources and current product details
Check the maker’s current documentation for availability, limits and pricing.