 UsefulShelf
Evil Charts
Developer toolsAnimated React chart components for shadcn/ui
The useful details
About Evil Charts
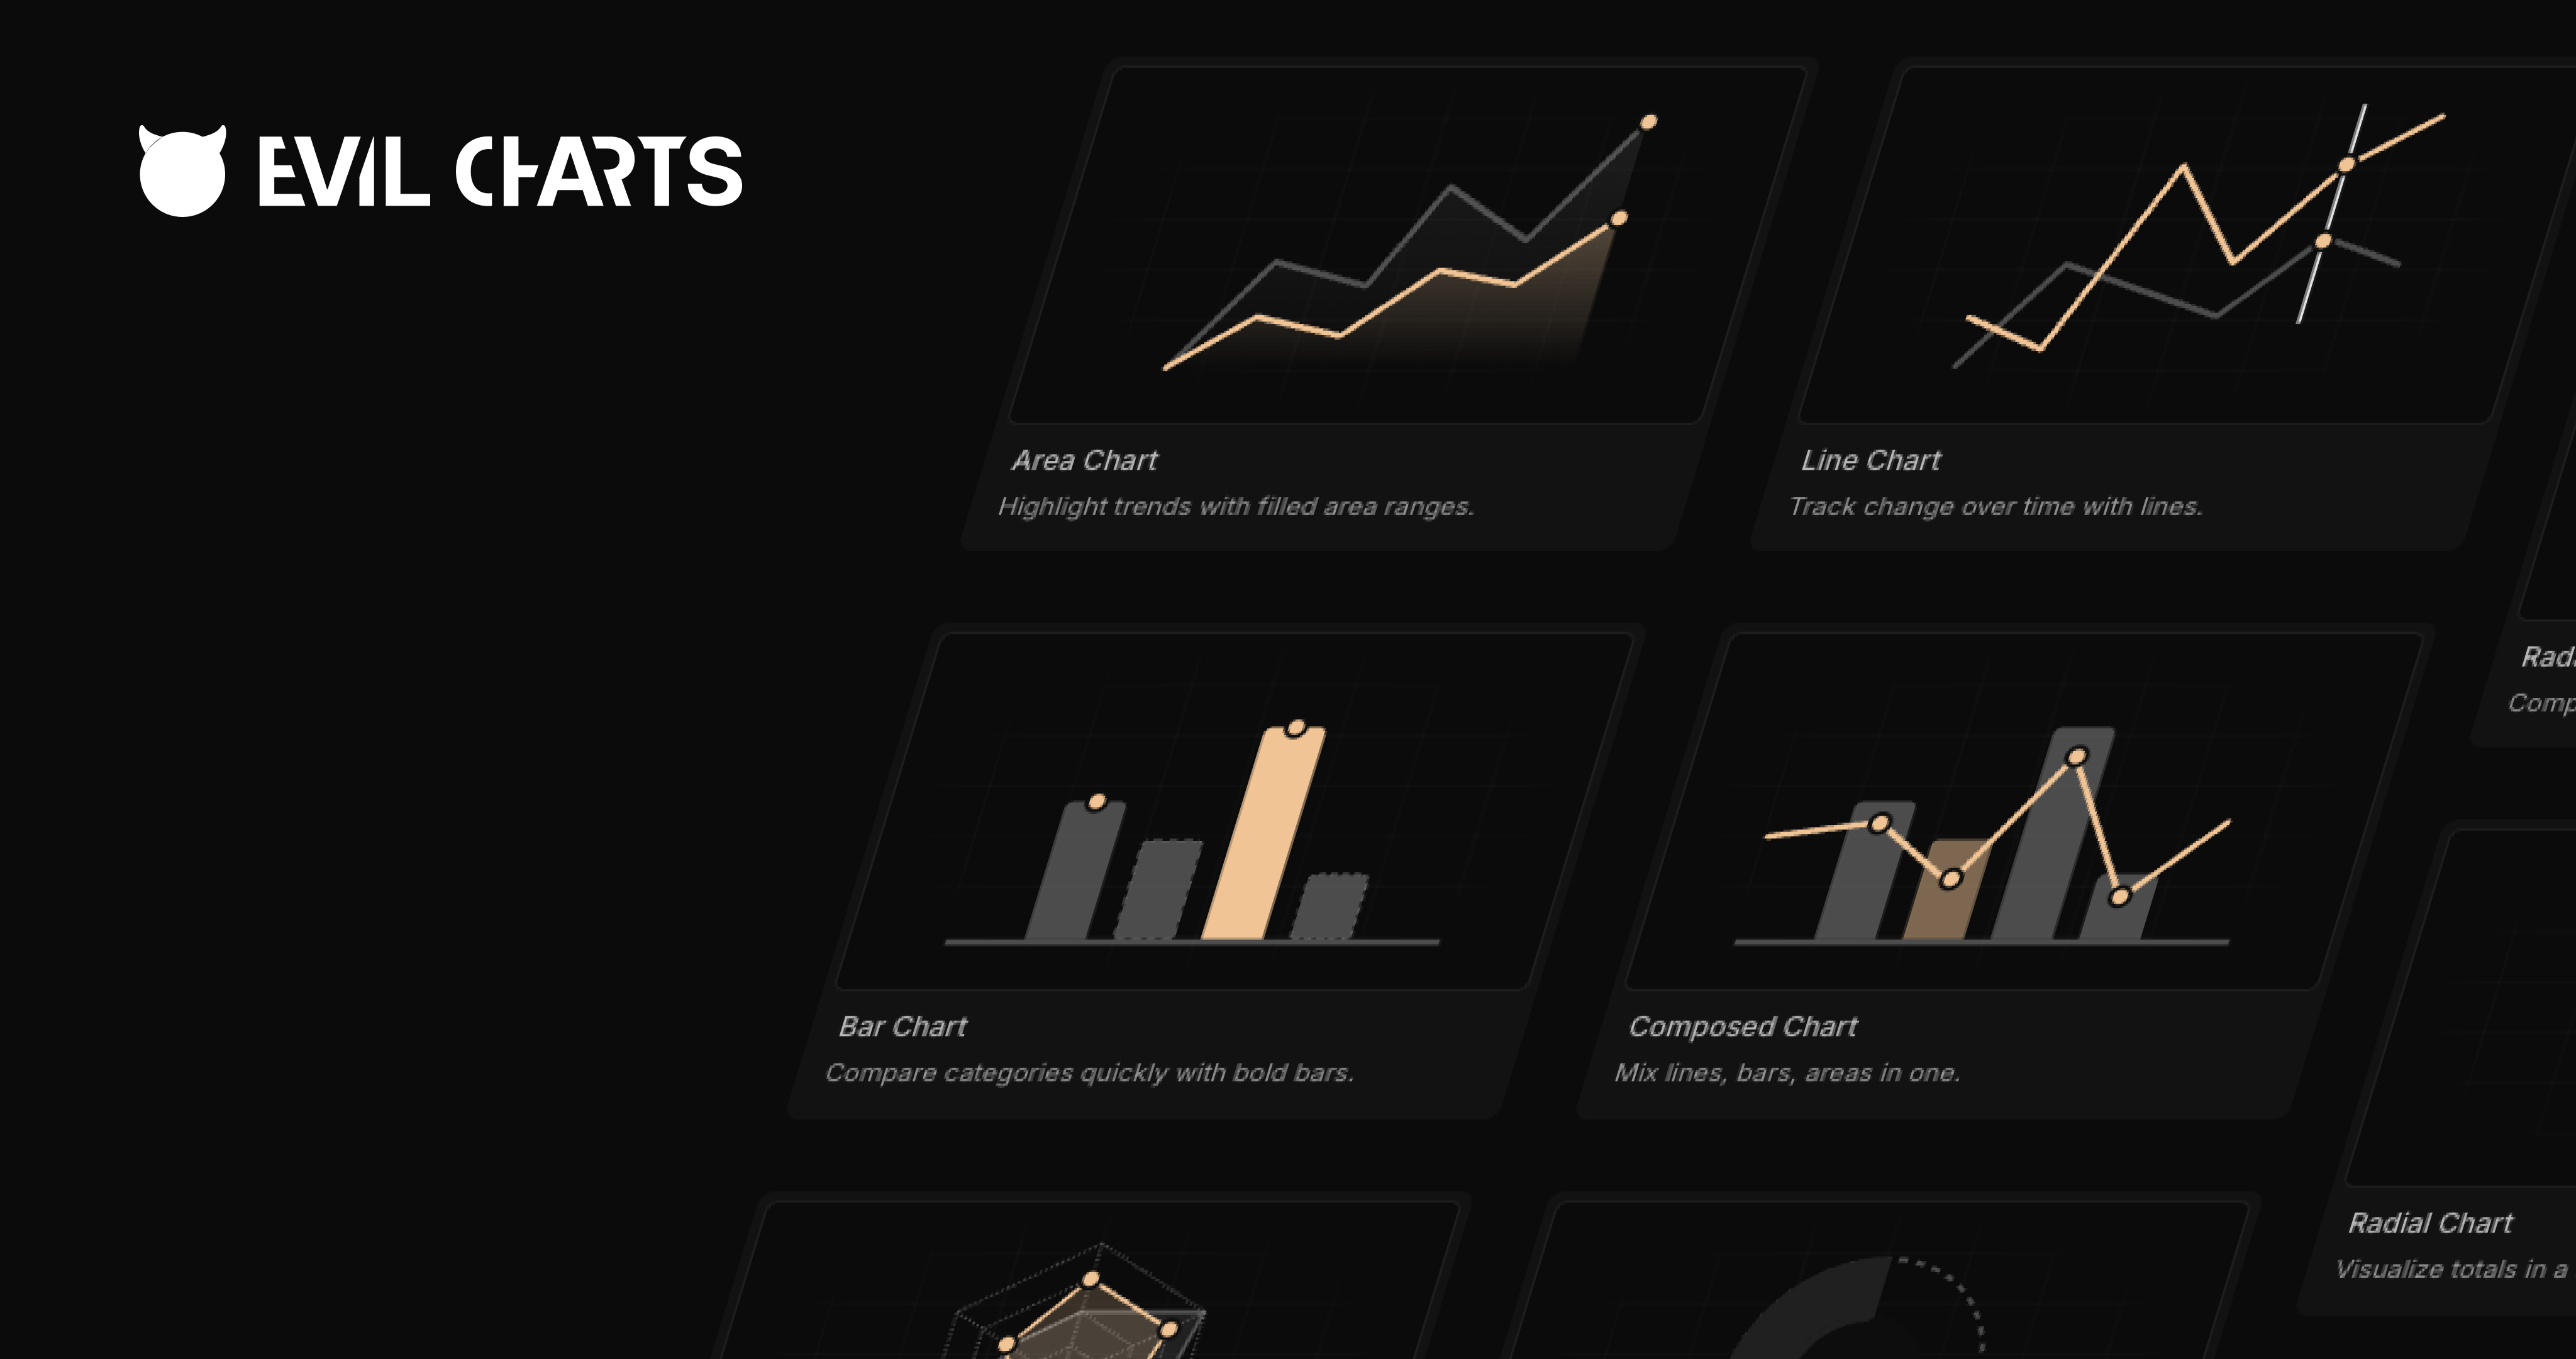
Evil Charts is a collection of animated, interactive chart components for React, built on Recharts and Apache ECharts and styled for shadcn/ui and Tailwind CSS. It is aimed at developers building dashboards and product pages who want polished charts whose source they can edit. Its author built it after failing to find chart components with smooth animation and dynamic data.
Components are installed with the shadcn CLI, so the code is copied into the project instead of living in a package. Chart types include area, bar, line, composed, pie, radar, radial and Sankey charts, with shared parts for tooltips, legends, dots, backgrounds and a brush that zooms to a draggable range of the data. A single config object sets the label, icon and light and dark colors for each data series, and an array of colors produces a gradient fill. Light and dark themes switch with a class, without a re-render.
The documentation recommends starting with Recharts and moving an individual chart to its Apache ECharts version, which draws to Canvas by default, when that chart becomes heavy.
Evil Charts is free and open source under the MIT license, with source on GitHub. It expects a React or Next.js project with shadcn/ui and Recharts. A documentation MCP server and an agent skill are published for AI coding assistants.
- Pricing
- Features
- Website
- evilcharts.com
- Listed
- Updated
Summarize with AI
Choose an assistant to open a summary prompt for this app.
Similar apps
Browse more in Developer tools



Every listing is reviewed before it goes live. How review works